Practical steps to build live dashboards that raise throughput and on-time delivery.
Build the right KPI foundation for shop-floor decisions
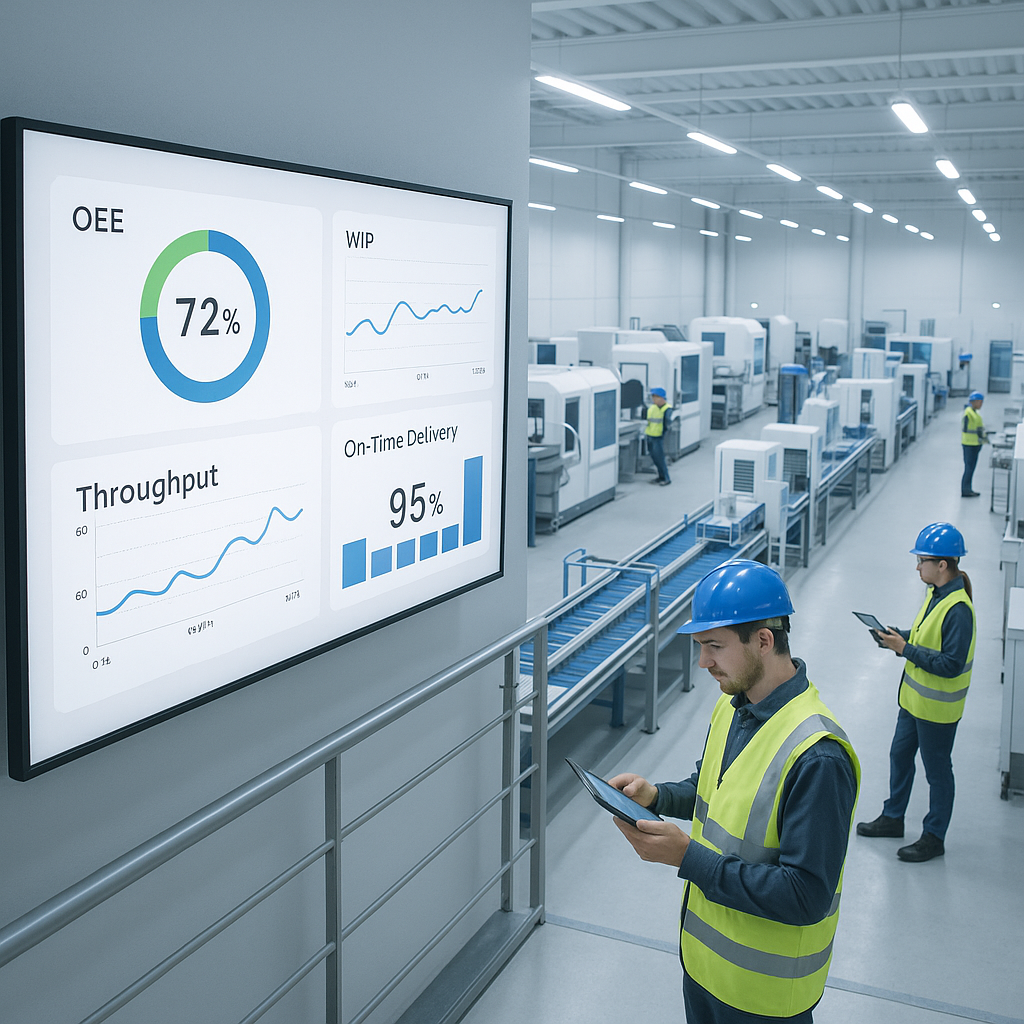
Throughput rises when teams share a common view of performance. Start by agreeing on a short list of measures that reflect flow, quality, and delivery. OEE, on-time delivery, first pass yield and schedule adherence form a practical set that most plants can calculate with data you already have. Keep formulas consistent across work centers so teams compare apples to apples. Define ownership for each KPI and show how actions on the floor move the needle. Give people simple targets and a visible scoreboard so wins are clear.
Keep the list short. If a KPI does not drive daily behavior, drop it. Your goal is to equip supervisors to make quick calls, not to build a data warehouse for its own sake. When leaders see lagging delivery, they should trace the signal back to setup times, changeover plans, and bottleneck availability. When scrap rises, they should link defects to specific operations, lots and operators. A focused set of KPIs makes these conversations direct and useful.
Connect ERP, machines and teams for live visibility
Dashboards only work when they pull from a single source of truth. Connect ERP, shop transactions and machine data so numbers match at every level. Job progress, material issues, labor capture and quality checks should update immediately, not at day end. This live context helps planners adjust priorities and gives buyers a realistic view of shortages and lead times. A digital thread approach ties engineering, planning, production and suppliers together so traceability and context travel with the product record. For perspective on how a digital thread strengthens supply chains and decision speed, see NIST’s roadmap at Digital Thread Roadmap.
Make access role based. Operators need simple tiles with today’s work and and alerts. Supervisors need WIP age, constraints and exceptions. Executives need margin, cash and service levels. Use mobile views so leaders can walk the floor and act on what they see. Keep data quality high with barcode scanning and short forms. The best dashboards depend on fast, accurate transactions at the point of work.
Turn insight into action with simple daily routines
Insight must lead to action. Build a daily rhythm that turns dashboards into results. Start with short tier meetings at the line, then roll up to a plant huddle that reviews yesterday’s goals and today’s risks. Assign clear owners for each exception and agree on the next test. Small experiments beat big projects because they teach fast and reduce risk. Post wins so people see progress. Review weekly trends to spot chronic issues like changeover delays or supplier slips. Protect time for problem solving so urgent noise does not crowd out real improvement.
Retire widgets that no one uses and promote a few views that everyone trusts. Keep the connection to customers visible by linking metrics to promise dates and quality escapes. When teams understand the why, they lean in. If you want dashboards that align with your flow and connect ERP to the floor, our team can help you move from reports to real-time decisions. Contact us to talk through your plant’s goals.