
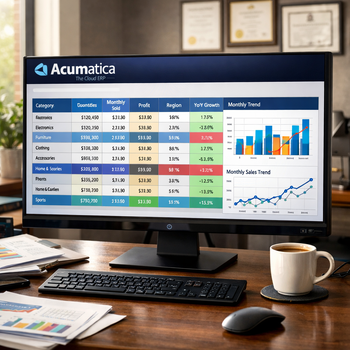
Acumatica Cloud ERP holds valuable information about sales, inventory, customers, projects and financial performance. However, reviewing rows of transaction data does not always make trends easy to recognize. Teams need a practical way to organize that information and view it from different angles.
Pivot tables in Acumatica allow users to summarize, group and analyze ERP data without exporting it to a separate spreadsheet. Users can transform detailed records into a more focused view that supports reporting and faster decision-making.
Watch the video to see an example of how a pivot table can be created and used within Acumatica Cloud ERP.
Organize Data Around the Question
A pivot table allows users to arrange information based on the business question they are trying to answer. Data fields can be placed into rows and columns while numerical information is summarized through totals, counts or other calculations.
Depending on the underlying data, pivot tables may help users analyze:
- Sales by customer or product
- Revenue by month or branch
- Inventory activity by warehouse
- Purchases by vendor
- Project costs by task
- Transactions by account or department
- Quantities and margins by category
Users can adjust the layout to explore the same data from another perspective without rebuilding the source inquiry.
Move from Details to Summaries
Acumatica pivot tables are built using information from a Generic Inquiry. The inquiry determines which records and fields are available for analysis, while the pivot table presents that information in a summarized format.
Filters can narrow the results to a specific period, location or category. Users can group information, calculate totals and reorganize fields to highlight meaningful patterns.
This provides a faster way to review performance while keeping the analysis connected to information stored in Acumatica.
Make Reporting More Flexible
Different employees often need different views of the same information. A sales manager may focus on revenue by customer while an operations leader reviews quantities by product or warehouse.
Pivot tables give users flexibility without requiring a new custom report for every question. Once configured, the analysis can be accessed again as updated information enters the system.
Watch the video above to see an Acumatica pivot table example, then talk with 3Value about creating reporting tools that help your team better understand its data.